A general plotting function that automatically detects variable type and draws the appropriate plot. It also provides facilities to add inference information to plots, colour- and size-by variables, and can handle survey data.
iNZightPlot(
  x,
  y = NULL,
  g1 = NULL,
  g1.level = NULL,
  g2 = NULL,
  g2.level = NULL,
  varnames = list(),
  colby = NULL,
  sizeby = NULL,
  symbolby = NULL,
  extra.vars,
  locate = NULL,
  locate.id = NULL,
  locate.col = NULL,
  locate.extreme = NULL,
  locate.same.level = NULL,
  highlight = NULL,
  data = NULL,
  design = NULL,
  freq = NULL,
  missing.info = TRUE,
  xlab,
  ylab,
  show_units = TRUE,
  new = TRUE,
  inzpars = inzpar(),
  layout.only = FALSE,
  plot = TRUE,
  xaxis = TRUE,
  yaxis = TRUE,
  xlim = NULL,
  ylim = NULL,
  zoombars = NULL,
  hide.legend = FALSE,
  df,
  env = parent.frame(),
  ...
)
Arguments
- x
a vector (numeric or factor), or the name of a column in the supplied
dataordesignobject- y
a vector (numeric or factor), or the name of a column in the supplied
dataordesignobject- g1
a vector (numeric or factor), or the name of a column in the supplied
dataordesignobject. This variable acts as a subsetting variable.- g1.level
the name (or numeric position) of the level of
g1that will be used instead of the entire data set- g2
a vector (numeric or factor), or the name of a column in the supplied
dataordesignobject. This variable acts as a subsetting variable, similar tog1- g2.level
same as
g1.level, however takes the additional value"_MULTI", which produces a matrix ofg1byg2- varnames
a list of variable names, with the list named using the appropriate arguments (i.e.,
list(x = "height", g1 = "gender"))- colby
the name of a variable (numeric or factor) to colour points by. In the case of a numeric variable, a continuous colour scale is used, otherwise each level of the factor is assigned a colour
- sizeby
the name of a (numeric) variable, which controls the size of points
- symbolby
the name of a factor variable to code point symbols
- extra.vars
the names of any additional variables to be passed through the internal functions to the create and plot methods.
- locate
variable to label points
- locate.id
id of points (row numbers) to label, or an expression that evaluates as a logical vector (e.g.,
x > 5)- locate.col
the colour to locate points if a variable is not specified
- locate.extreme
numeric, the number of extreme points to label (using Mahalanobis' distance)- locate.same.level
name of a variable to label points with same level of as those specified with `locate.id`
- highlight
numericvector consisting of the row numbers/IDs of points to highlight- data
the name of a data set
- design
the name of a survey object, obtained from the
surveypackage- freq
the name of a frequency variable if the data are frequencies
- missing.info
logical, if
TRUE, information regarding missingness is displayed in the plot- xlab
the text for the x-label
- ylab
the text for the y-label
- show_units
logical, if `TRUE` (default) units will be shown beside axies and legend variable labels
- new
logical, used for compatibility
- inzpars
allows specification of iNZight plotting parameters over multiple plots
- layout.only
logical, if
TRUE, only the layout is drawn (useful if a custom plot is to be drawn)- plot
logical, if
FALSE, the plot is not drawn (used bysummary)- xaxis
logical, whether or not to draw the x-axis
- yaxis
logical, whether or not to draw the y-axis
- xlim
specify the x limits of the plot
- ylim
specify the y limits of the plot
- zoombars
numeric, length 2; when drawing a bar plot, if the number of bars is too large, the user can specify a subset. The first value is the starting point (1 is the first bar, etc), while the second number is the number of bars to show.
- hide.legend
logical, if TRUE, the
legendwill not be drawn- df
compatibility argument
- env
compatibility argument
- ...
additional arguments, see
inzpar
Value
An inzightplotoutput object, which contains the information
displayed in the plot
Details
The main goal of 'iNZightPlots' is to make it easy to beginners to explore a dataset graphically, using a suite of simple arguments to add features to their graph.
The second use of this function is within the companion software 'iNZight', providing a single function call with arguments controlled by the user through a GUI.
Examples
iNZightPlot(Species, data = iris)
 iNZightPlot(Petal.Width, g1 = Species, data = iris)
 iNZightPlot(Sepal.Length, Sepal.Width, data = iris,
colby = Species)
iNZightPlot(Sepal.Length, Sepal.Width, data = iris,
colby = Species)
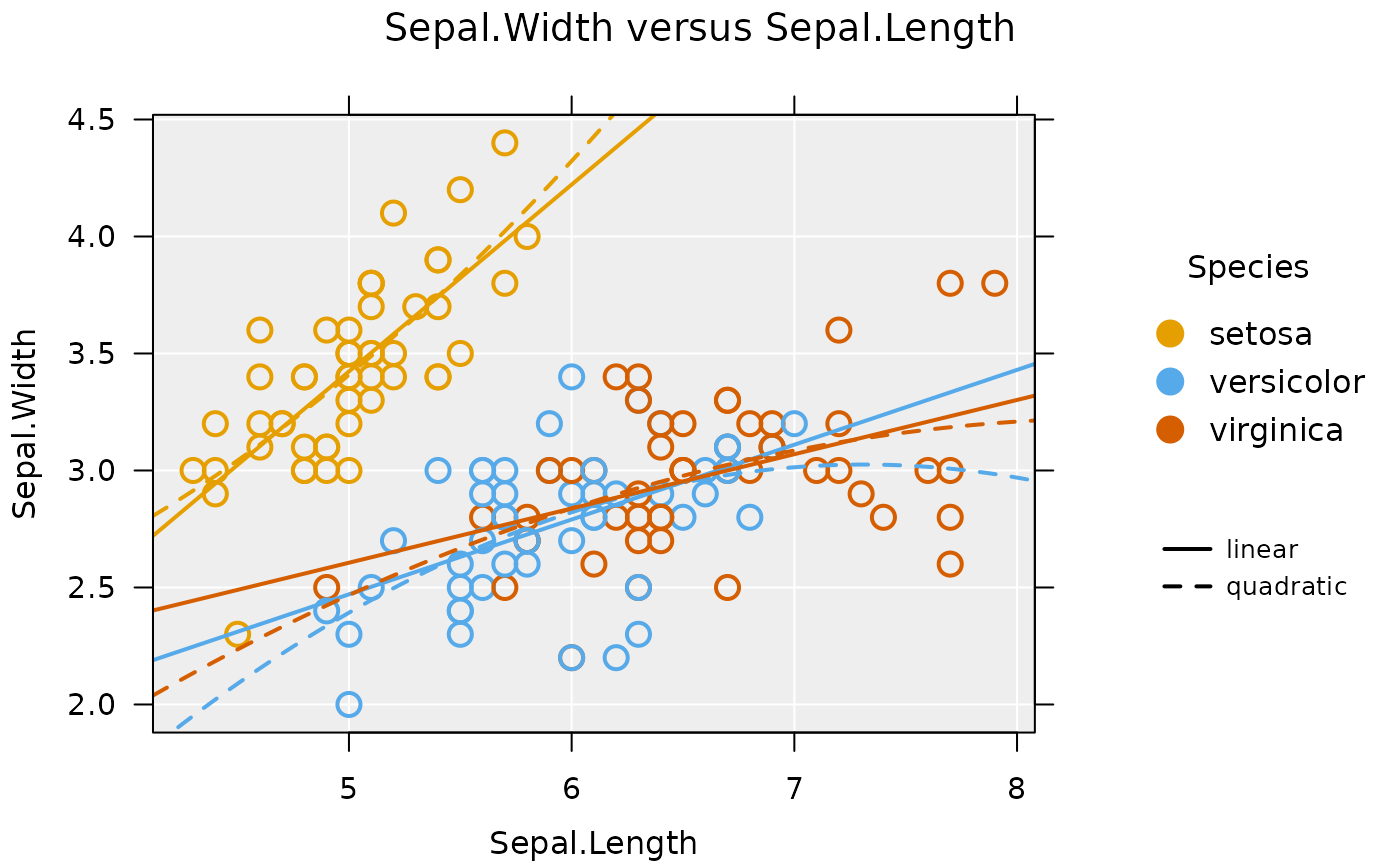
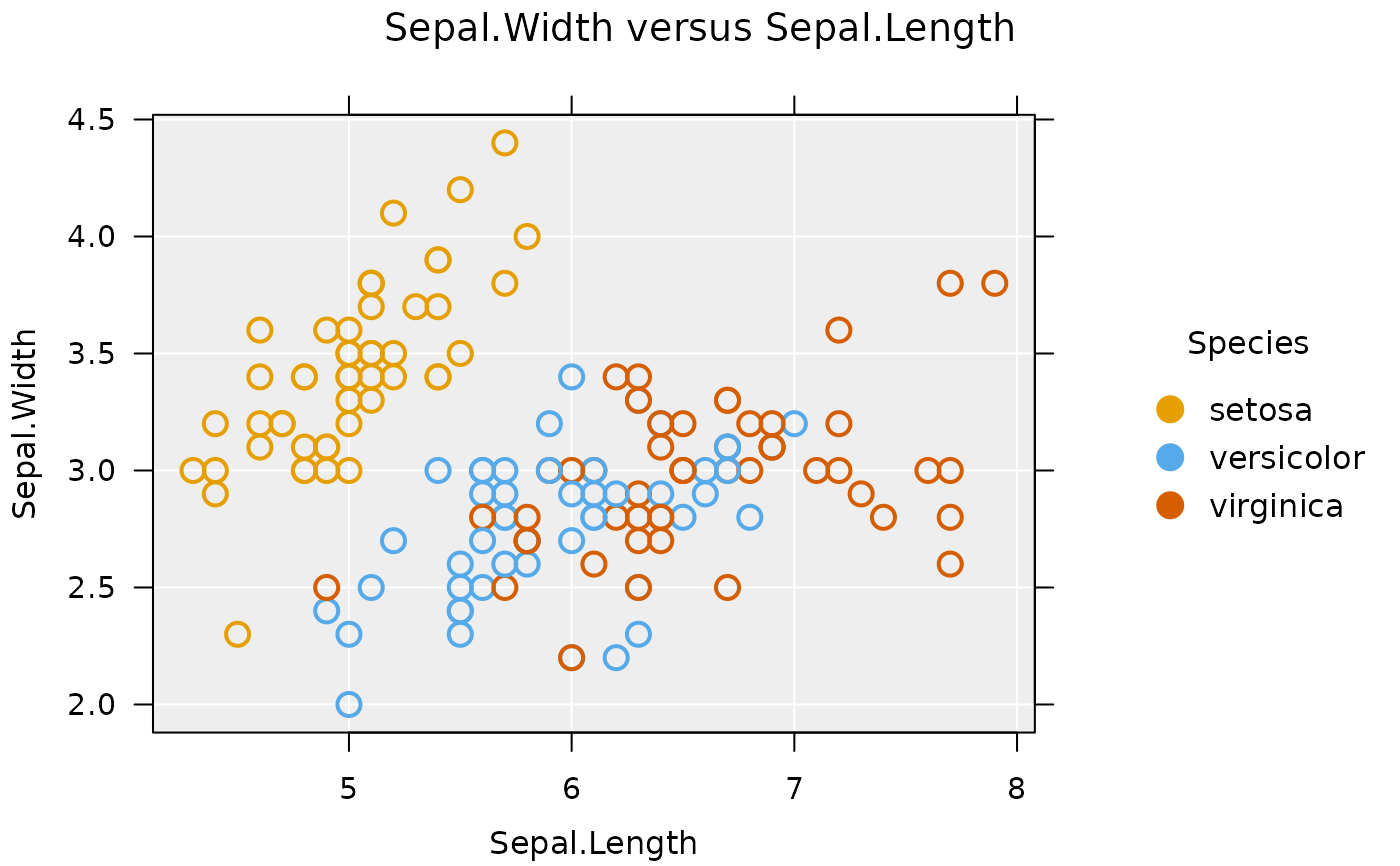 iNZightPlot(Sepal.Length, Sepal.Width, data = iris,
colby = Species, trend = c("linear", "quadratic"),
trend.by = TRUE, trend.parallel = FALSE)
iNZightPlot(Sepal.Length, Sepal.Width, data = iris,
colby = Species, trend = c("linear", "quadratic"),
trend.by = TRUE, trend.parallel = FALSE)
 # add inference information
iNZightPlot(Petal.Width, data = iris,
inference.type = "conf", inference.par = "mean")
# add inference information
iNZightPlot(Petal.Width, data = iris,
inference.type = "conf", inference.par = "mean")
 iNZightPlot(Petal.Width, data = iris,
inference.type = "conf", inference.par = "mean",
bootstrap = TRUE)
iNZightPlot(Petal.Width, data = iris,
inference.type = "conf", inference.par = "mean",
bootstrap = TRUE)
 # alternatively, use the formula interface
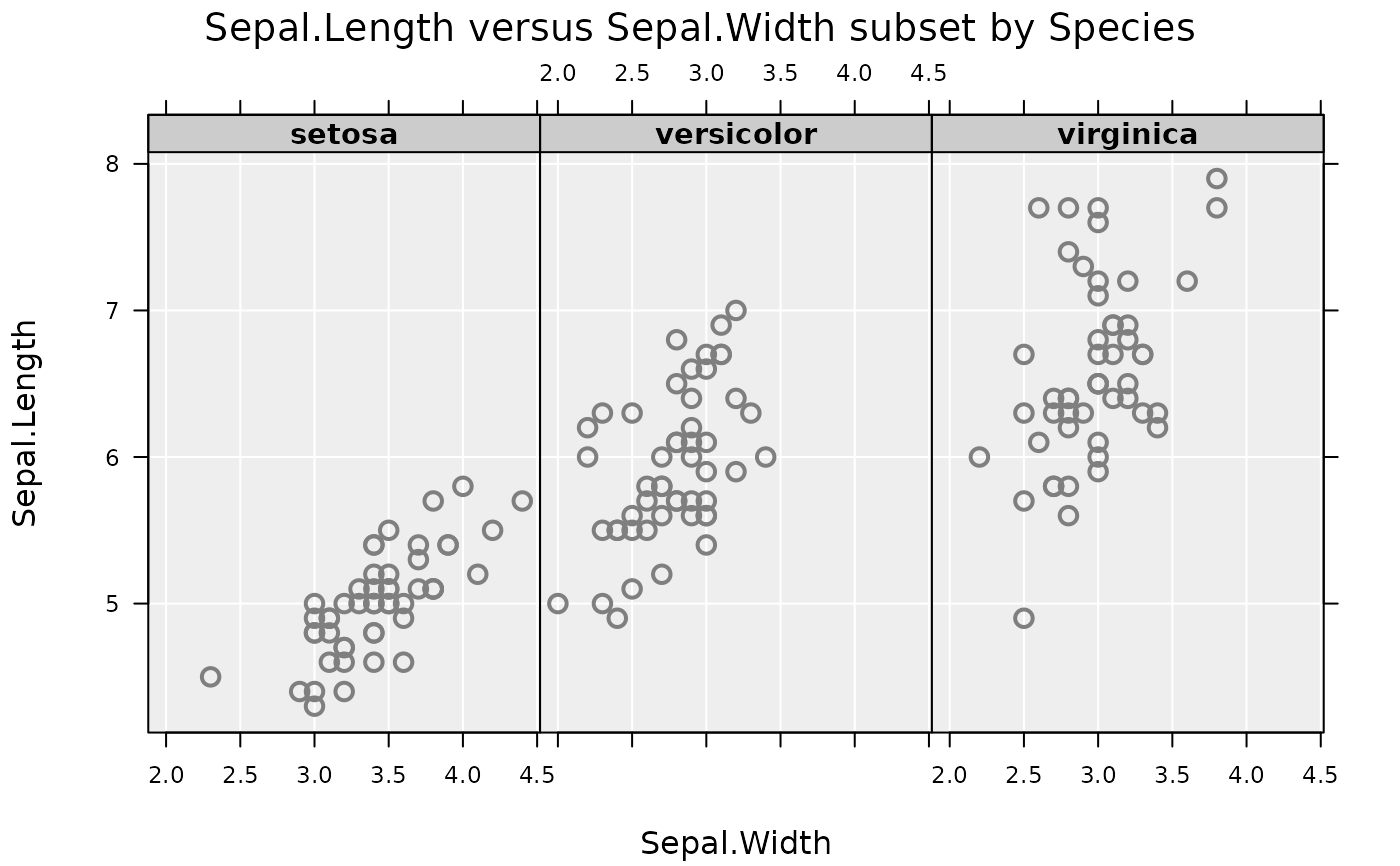
inzplot(Sepal.Length ~ Sepal.Width | Species, data = iris)
# alternatively, use the formula interface
inzplot(Sepal.Length ~ Sepal.Width | Species, data = iris)